Paperless Math
"Math is not done with paper, pencil, or a calculator; math is done with the brain."
You are here
Standard Deviation Visualization
Preview:
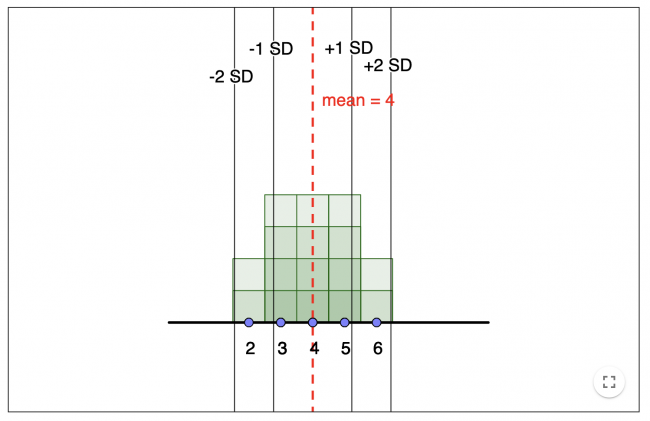
This activity lets students visualize the relationship between the standard deviation and mean of a data set and the distribution of data for that data set.
Grade:
Grade 12
Content:
summary statistics:
— measures of centre, spread (range, variance, standard deviation interquartile range), including five-number summary
Curricular Competency:
Reasoning and analyzing: Use reasoning to explore and make connections
Reasoning and analyzing: Use technology to explore mathematics
Understanding and solving: Visualize to explore mathematical concepts
Communicating and representing: Use mathematical vocabulary and language to contribute to mathematical discussions
Add new comment