Paperless Math
"Math is not done with paper, pencil, or a calculator; math is done with the brain."
You are here
Visualizing Samples
Preview:
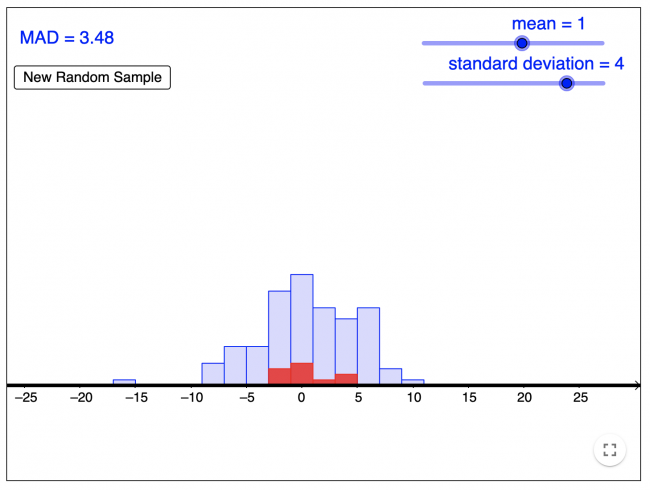
In this activity, you can change the mean and standard deviation for two different sets to see the impact on the histogram. You can also compare the characteristics of a random sample of 10 points taken from the whole population. Try clicking on New Random Sample and look to see how the sample compares to the overall data.
Grade:
Grade 12
Task Type:
Technology
Content:
summary statistics:
— measures of centre, spread (range, variance, standard deviation interquartile range), including five-number summary
— use of simulation software to explore sampling distributions
Curricular Competency:
Reasoning and analyzing: Use reasoning to explore and make connections
Reasoning and analyzing: Use technology to explore mathematics
Understanding and solving: Visualize to explore mathematical concepts
Communicating and representing: Use mathematical vocabulary and language to contribute to mathematical discussions
Add new comment