Paperless Math
"Math is not done with paper, pencil, or a calculator; math is done with the brain."
You are here
Visualize a Data Set
Preview:
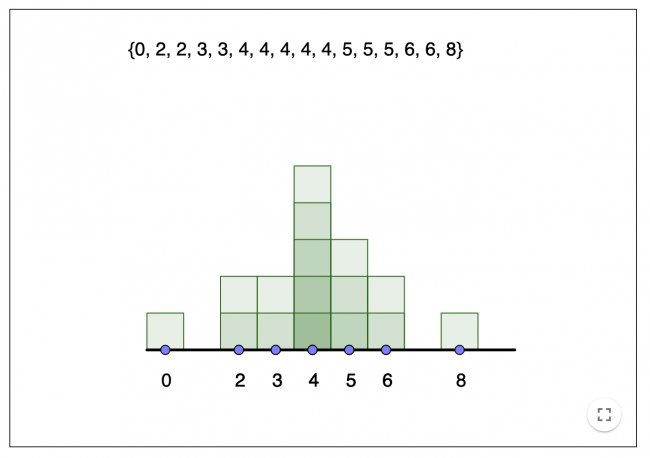
This activity lets students visualize the relationship between a list view of a data set and a frequency distribution view of the data.
Grade:
Grade 4
Task Type:
Technology
Content:
many-to-one correspondence: one symbol represents a group or value (e.g., on a bar graph, one square may represent five cookies)
Curricular Competency:
Reasoning and analyzing: Use reasoning to explore and make connections
Reasoning and analyzing: Use technology to explore mathematics
Understanding and solving: Visualize to explore mathematical concepts
Add new comment