Paperless Math
"Math is not done with paper, pencil, or a calculator; math is done with the brain."
You are here
Visualize the Mean and Median
Preview:
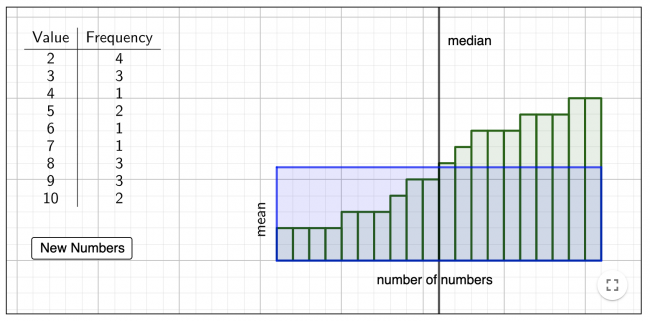
This activity lets students visualize the relationship between a table of values showing the frequency of different numbers and the mean and median of that set of data.
Grade:
Grade 8
Task Type:
Technology
Big Idea:
Grade 8: Analyzing data by determining averages is one way to make sense of large data sets and enables us to compare and interpret.
Curricular Competency:
Reasoning and analyzing: Use reasoning to explore and make connections
Reasoning and analyzing: Use technology to explore mathematics
Understanding and solving: Visualize to explore mathematical concepts
Communicating and representing: Use mathematical vocabulary and language to contribute to mathematical discussions
Add new comment